Model-Drift: Hoe je AI-Modellen werkend houdt in een veranderende wereld
/
Model-Drift: Hoe je AI-Modellen werkend houdt in een veranderende wereld
In een wereld waar machine learning-modellen steeds vaker ingezet worden in productieomgevingen, is het bewaken van hun prestaties over tijd essentieel. Modellen die vandaag accuraat voorspellen, kunnen morgen al uit de pas lopen. Dit fenomeen, beter bekend als model drift, vormt een serieuze uitdaging voor bedrijven die AI op schaal gebruiken.
In deze blogpost nemen we je mee in de wereld van model drift:
- Wat het precies is en welke vormen er bestaan?
- Waarom het zo belangrijk is om het vroegtijdig op te merken?
- Hoe kan je driftdetectie toepassen op zowel tabular als non-tabular data, zoals afbeeldingen?
- En hoe hebben we een praktische demo heb gebouwd in Jupyter Notebook die visuele drift in beeld brengt?
Of je nu een data scientist bent die AI-oplossingen onderhoudt of een MLOps engineer die inzet op monitoring, deze blogpost laat zien hoe je jouw modellen betrouwbaar houdt in een veranderende wereld.
Main section
Kerngegevens
/
Model drift treedt gemiddeld al op binnen 3 tot 6 maanden
/
Er bestaan meerdere vormen van drift
/
Drift in non-tabular data, zoals beelden of audio, is lastiger te detecteren
Wat is model drift en welke vormen bestaan er?
Model drift, ook wel concept drift genoemd, verwijst naar de situatie waarin een AI- of machine learning-model slechter begint te presteren omdat de data waarop het moet voorspellen, veranderd is ten opzichte van de data waarop het getraind werd. In een wereld die continu evolueert, is het logisch dat ook gebruikersgedrag, omgevingsfactoren of onderliggende trends veranderen – en dus ook de relevantie van het model.
Er zijn verschillende vormen van model drift:
- Covariate Drift: Hierbij verandert de verdeling van de inputfeatures (X), maar blijft de relatie met de output (Y) hetzelfde. Bijvoorbeeld: een model voor verkeersvoorspellingen dat plots veel meer elektrische voertuigen in de data ziet.
- Label Drift (Prior Probability Shift): Hierbij verandert de verdeling van de doelvariabele (Y). Denk aan een fraudedetectiemodel waar het aantal fraudegevallen in de dataset sterk stijgt of daalt.
- Concept Drift: Hier verandert de relatie tussen input en output (P(Y|X)). Bijvoorbeeld: een model dat klanttevredenheid voorspelt op basis van reviewteksten, maar de betekenis van woorden zoals “snel” of “goedkoop” verandert doorheen de tijd of cultuur.
- Data Quality Drift: Soms verandert niet de data zelf, maar de kwaliteit ervan. Sensoren die slechter functioneren of datasets die incompleet of inconsistent worden kunnen zo het model negatief beïnvloeden.
Door model drift op te sporen en aan te pakken, zorg je ervoor dat jouw AI-model relevant en betrouwbaar blijft, ook wanneer de wereld rondom verandert.
Hoe kan je model drift detecteren?
Model drift detecteren is cruciaal om te vermijden dat je model onzichtbaar achteruitgaat. Gelukkig bestaan er verschillende strategieën en tools om dit proactief op te volgen, zowel voor tabulaire als niet-tabulaire data.
Statistische monitoring
De eenvoudigste manier om drift op te sporen is het regelmatig vergelijken van distributies. Denk aan:
- Kolmogorov-Smirnov tests voor continue features
- Chi-kwadraat tests voor categorische variabelen
- Population Stability Index (PSI) om verschillen in distributies te meten over tijd
Deze methodes worden vooral gebruikt voor tabulaire data en zijn eenvoudig te automatiseren.
Model performance tracking
Een daling in metrics zoals accuracy, precision, recall of AUC kan wijzen op drift. Belangrijk hierbij:
- Meet performance op recente ground truth data
- Gebruik rolling windows voor trendanalyse
- Combineer met confidence monitoring (hoe zeker is het model van zijn voorspellingen?)
Embedding- of representatievergelijking
Voor niet-tabulaire data (zoals afbeeldingen, tekst of audio) is klassieke distributieanalyse vaak niet voldoende. Hier gebruik je:
- Embeddings uit een neuraal netwerk (zoals activaties van een tussenlaag)
- Visualisaties zoals t-SNE of UMAP
- Vergelijking via Frechet Inception Distance (FID) of Maximum Mean Discrepancy (MMD)
Zo kan je bijvoorbeeld detecteren of nieuwe afbeeldingen fundamenteel andere content bevatten dan je trainingsset.
Dedicated tools
Platformen zoals Azure Machine Learning, AWS SageMaker bieden ingebouwde model monitoring. Ze ondersteunen:
- Automatische drift detective
- Dashboards met realtime statistieken
- Alerts bij overschrijding van drempelwaardes
Bijvoorbeeld, in Azure ML kan je DataDriftDetector gebruiken om datasets te vergelijken via schema's en statistieken, inclusief visuele vergelijking van features.
Het is niet genoeg om één metric of methode te gebruiken. Een robuuste detectiestrategie combineert statistiek, performance monitoring en embeddingvergelijking, afgestemd op het datatype van je modelinput.
Hoe detecteer je model drift bij niet-tabulaire data?
In tegenstelling tot gestructureerde tabellen, is het detecteren van drift bij beelden, audio of tekst minder rechtlijnig. Je kan moeilijk de gemiddelde pixelwaarde van een foto vergelijken zoals je dat met een kolom in een Excel-bestand zou doen. Toch zijn er effectieve methodes om ook bij niet-tabulaire data model drift te detecteren. Hieronder enkele benaderingen:
Gebruik van feature- of embedding spaces
In plaats van de ruwe data zelf te vergelijken (zoals de pixelwaarden van beelden), kan je een model gebruiken om de data eerst te transformeren naar een meer betekenisvolle representatie:
- Voor beelden: gebruik activaties uit een tussenlaag van een CNN (zoals VGG of ResNet)
- Voor tekst: gebruik transformer-gebaseerde embeddings (zoals BERT)
- Voor audio: gebruik MFCC’s of spectrogrammen als representatie
Deze vectorrepresentaties (embeddings) geven een samenvatting van de inhoud van de input, wat het mogelijk maakt om veranderingen in “betekenis” of “inhoud” over tijd te meten.
Visuele technieken
Zodra je embeddings hebt, kan je technieken toepassen zoals:
- t-SNE of UMAP om de verdeling van de data visueel te maken in 2D
- Clusteranalyse om nieuwe patronen of uitbijters te ontdekken
- Overlays van voor- en na-data om veranderingen te illustreren
Deze technieken helpen je om intuïtief te begrijpen of de structuur van je inputdata veranderd is sinds het trainen van je model.
Vergelijkingsmetriek tussen distributies
Je kan de afstand tussen de distributies van oude en nieuwe data meten met behulp van:
- Maximum Mean Discrepancy (MMD)
- Frechet Inception Distance (FID) voor beelden
- Cosine similarity of Euclidean distance tussen embedding-centroids
Wanneer deze afstanden een bepaalde drempel overschrijden, heb je een indicatie van drift.
Gebruik maken van Deepchecks en soortgelijke tools
Tools zoals Deepchecks voorzien specifieke checks zoals ImageDatasetDrift, die automatisch:
- Data in batches verwerkt
- Distributies vergelijkt via statistieken en embeddings
- Visualisaties toont van mogelijke afwijkingen
In onze eigen demo gebruikten we deepchecks.vision (Python library) om drift op te sporen tussen originele afbeeldingen en hun felverlichte tegenhangers.
Praktijkvoorbeeld: Detectie van visuele drift
Om model drift bij niet-tabulaire data tastbaar te maken, bouwden we een demo rond beeldclassificatie met Deepchecks Vision. Het scenario: een bedrijf gebruikt een beeldherkenningsmodel om objecten op een transportband te classificeren en automatisch te sorteren per type. De camera die deze beelden vastlegt, staat naast een raam. In de zomermaanden zorgt het extra zonlicht voor veel helderdere beelden dan tijdens de winter, een verschil dat het model niet kende tijdens zijn training. Dit leidt tot een potentieel risico op model drift door veranderde lichtomstandigheden.
Vergelijking van winterdata vs zomerdata
Wanneer we het verschil in beelddata tussen winter en zomer visueel bekijken, wordt het probleem meteen duidelijk. In de winter zijn de beelden donkerder en meer in lijn met de oorspronkelijke trainingsdata van het model. In de zomer echter zorgt het extra daglicht voor overbelichte beelden, wat de kleurverdeling en contrasten beïnvloedt.
Deze visuele shift lijkt soms subtiel, maar kan grote gevolgen hebben voor een image classification model dat gevoelig is voor lichtomstandigheden. Hieronder zie je een vergelijking van typische winterbeelden tegenover fel belichte zomerbeelden, zoals die door de productielijncamera worden vastgelegd.
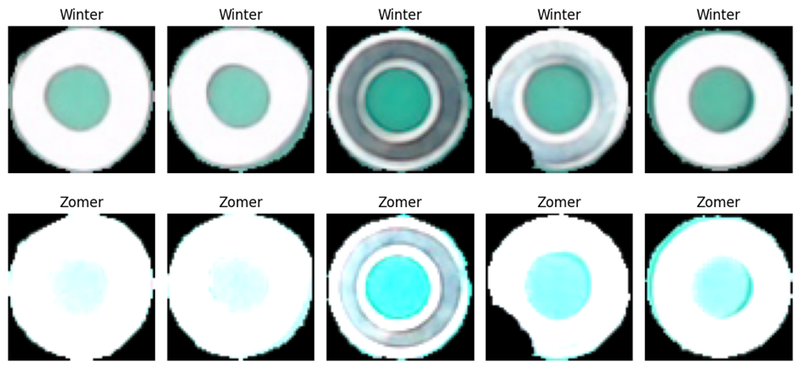
Zoals te zien is, kan een model dat alleen werd getraind op winterdata moeite hebben met correcte voorspellingen op zomerbeelden, wat model drift in de hand werkt.
Driftanalyse met Deepchecks
Voor de detectie gebruikten we de ImageDatasetDrift check uit deepchecks.vision library. Beide datasets werden eerst omgezet in batches van numpy-arrays met bijhorende labels via BatchOutputFormat.
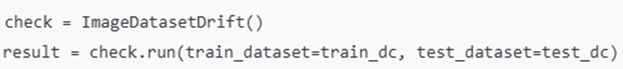
Deze check levert dan dit resultaat op:
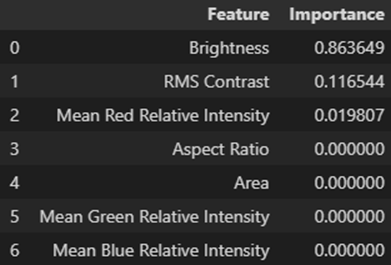
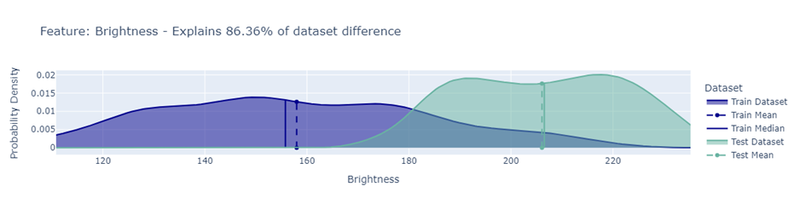
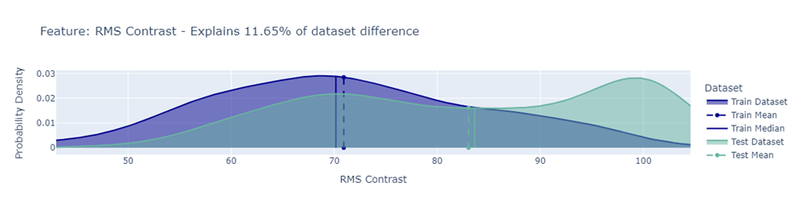
Elke feature krijgt in de analyse een importance score toegewezen, die aangeeft in welke mate deze eigenschap heeft bijgedragen aan de gedetecteerde drift tussen de datasets. Dit is bijzonder waardevol om te begrijpen waarom en welke visuele eigenschappen verschoven zijn. In dit geval blijkt vooral Brightness een dominante rol te spelen in het onderscheid tussen de trainingsdata en de testdata.
Onderstaande visualisaties, gegenereerd door Deepchecks, tonen duidelijk welke features de grootste impact hebben gehad op de gedetecteerde drift. De Train Dataset bevat de winterbeelden waarop het model oorspronkelijk werd getraind, terwijl de Test Dataset bestaat uit zomerbeelden die door verhoogde lichtinval merkbaar feller belicht zijn.
Dankzij deze interpretabele output kunnen we gericht analyseren welke visuele kenmerken in de data zijn verschoven, en dus ook welke factoren mogelijks verantwoordelijk zijn voor de daling in modelperformantie. Zo krijgen we niet alleen een signaal dat er drift is, maar ook inzicht in waar en hoe de data verschoven is, wat essentieel is voor monitoring en bijsturing in productieomgevingen.
De check geeft ook een drift score terug, een getal dat samenvat hoeveel verschuiving er is opgetreden tussen de twee datasets. In onderstaande visualisatie zie je hoe deze score geïnterpreteerd moet worde, hoe dichter bij 1, hoe sterker de drift.
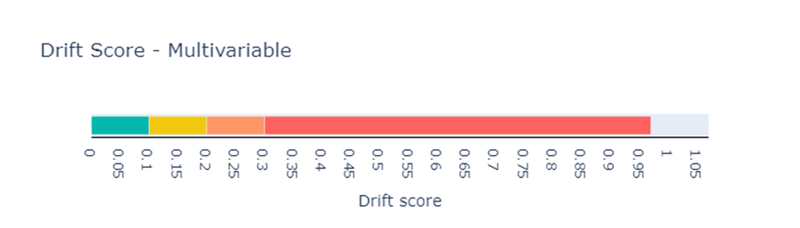
In ons geval bedroeg de domain_classifier_drift_score 0.9698, wat wijst op een duidelijke verschuiving in data. Zo'n hoge score suggereert dat het model waarschijnlijk aanzienlijke performantieproblemen zal ervaren op de nieuwe data.
3. Invloed op model performance
Om de impact van dataset drift op de prestaties van een model concreet te maken, trainden we een eenvoudige image classifier gebaseerd op de VGG-architectuur. Dit model werd uitsluitend getraind op de winterbeelden, die representatief zijn voor het oorspronkelijke productieproces waarin het model werd ontwikkeld. Het model werd getraind om twee klassen van objecten op afbeeldingen correct te classificeren.
Bij het testen van dit model op een aparte set van winterbeelden, dus data uit exact dezelfde distributie als waarop het getraind was, behaalde het model een perfecte accuracy van 100%. Dit geeft aan dat het model de taak volledig onder controle heeft zolang de inputbeelden visueel overeenkomen met de trainingsdata.
Daarna voerden we exact dezelfde test uit, maar met de zomerbeelden als inputdata. Deze beelden zijn identiek in inhoud (zelfde klassen), maar verschillen qua visuele eigenschappen zoals belichting. De zomerbeelden zijn bijvoorbeeld aanzienlijk feller door het invallende zonlicht. Ondanks dat het model op inhoudsniveau dezelfde taak uitvoerde, daalde de accuratescore naar slechts 78.57%.
Deze performance drop toont duidelijk aan dat het model gevoelig is voor visuele verschuivingen die buiten zijn trainingsdistributie vallen. Hoewel de taakinhoud gelijk bleef, zorgde de verandering in lichtintensiteit (die we eerder ook detecteerden via de drift check) voor een aanzienlijke afname in betrouwbaarheid. In een productieomgeving kan dit leiden tot foutieve classificaties en downstream fouten, bijvoorbeeld in automatische sorteersystemen.
Bottom section
Tot slot
Model drift is geen hypothetisch probleem, het is een realiteit voor elke AI-toepassing in productie. Door veranderingen in data vroegtijdig op te sporen en te begrijpen, voorkom je onverwachte prestatieverliezen. In dit artikel hebben we niet alleen de theorie toegelicht, maar ook aan de hand van een beeldclassificatie-demo met Deepchecks laten zien hoe je drift bij visuele data concreet kunt meten en verklaren.
Wil je je modellen betrouwbaar houden in een veranderende wereld? Dan is continue monitoring, ook voor non-tabular data, geen luxe maar een noodzaak.
Bekijk zeker ook onze Masterclass Deploying AI Solutions waarin Model Drift in detail verwerkt zit. Meer info op de website van Howest: https://www.howest.be/nl/opleidingen/navormingen/masterclass-deploying-ai-solutions
Contributors
Authors
/
Hube Knaepkens, intern
/
Nathan Segers, Lecturer XR and MLOps
Want to know more about our team?
Visit the team page